Objective and data sources
The aim of this study is to investigate the excess mortality in Germany from 2021. Thereby, 2 questions are in the foreground:
On the issue of excess mortality associated with Covid vaccines, there are two irreconcilable views: on the one hand, vaccine proponents who say that the vaccines would be free of side effects (such as the Secretary of Health and Human Services on Twitter); on the other hand, reviewers at the U.S. Food and Drug Administration who warn that for every life saved by Covid vaccination, two people die as a result of the side effects (Dr. Kirsch before the FDA approval committee). What are the options for resolving this apparently irreconcilable contradiction with publicly available data?
- Influence of covid-19 mortality
- Possible impact of Covid-19 vaccinations on mortality.
Data from the German Federal Statistical Office “Sonderauswertung Sterbefälle 2016-2022” (as of Jan. 17, 2022) are used as baseline data for all-cause mortality; data from the RKI (as of Jan. 23, 2022) are used for deaths “with and from Covid-19”; and data from the RKI (as of Jan. 21, 2022) are also used to determine vaccination rates (column with all vaccine doses). The all-cause mortality and vaccination rate data are daily, but those for Covid-19 deaths are published only weekly. Therefore, for comparability of data, all data sets are summarized to the 52 calendar weeks of 2021, but each is normalized to daily averages. Thus, the weekly values are divided by 7.
All figures used here are therefore supported by official sources and are comprehensible.
Excess mortality
First, the comparison of the total mortality figures of 2021 with the average of the total mortality figures of the years 2015-2019, known from other publications. The year 2020 was not used for averaging because it was not an “average year” beyond doubt due to the Corona outbreak. The systematic seasonal fluctuations (e.g., higher mortality due to flu outbreaks, etc., in winter) are evident in the average mortality:
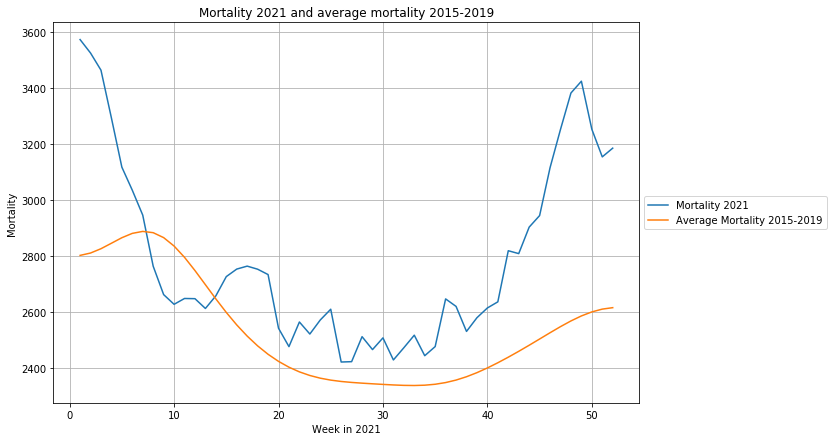
The difference between total mortality in 2021 and average mortality is the excess mortality. Unfortunately, the data source Vaccination Rate Monitoring is not broken down by age group, which is why we are not yet able to perform the even more meaningful age-group-specific analysis.
Consideration of Covid-19 deaths
First, this excess mortality (blue) is compared with Covid deaths (orange) published by the RKI:
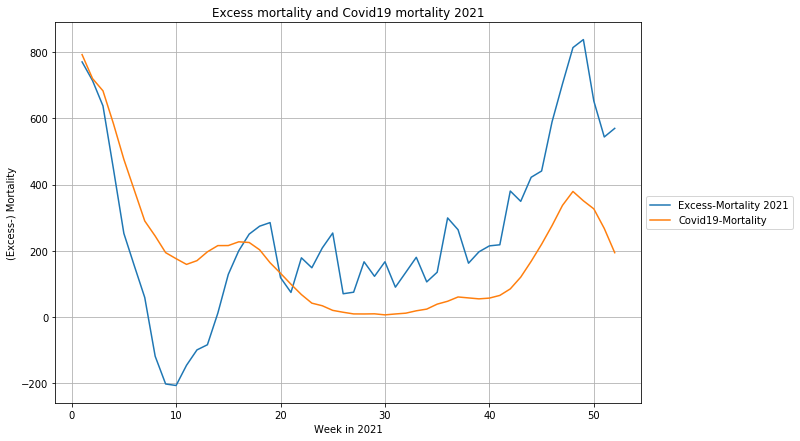
Here it is noticeable that the over-mortality of the first 4 calendar weeks changes into an under-mortality during the following weeks. This means that it is only partly a “real” excess mortality, partly it is a temporal shift of the “normal” seasonal higher mortality. To avoid having to have discussions on a side issue, we will refrain here from asking the complicated question of whether all “with-and-at” Covid-19 deaths are also true Covid-19 deaths.
If we subtract the Covid-19 deaths from the excess mortality determined above (orange), we get the “Covid-19”-adjusted excess mortality (blue)
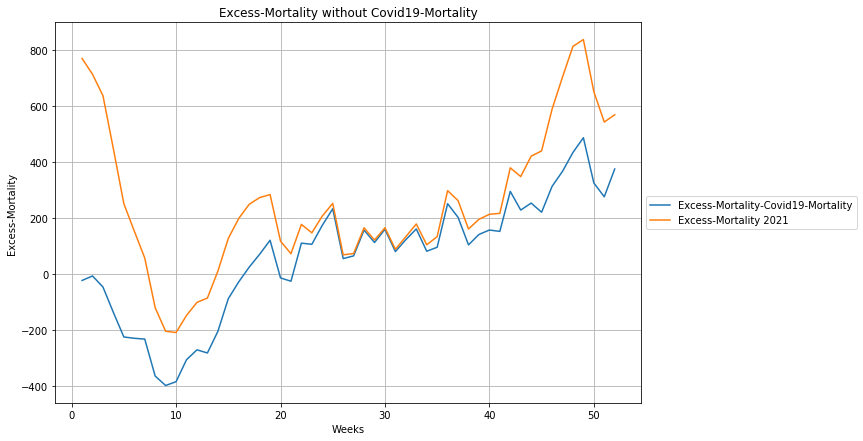
We now compare this Covid-adjusted excess mortality curve, which shows excess mortality increasing from calendar week 16, with the curve of total vaccine doses administered, the sum of all first, second, and booster doses:
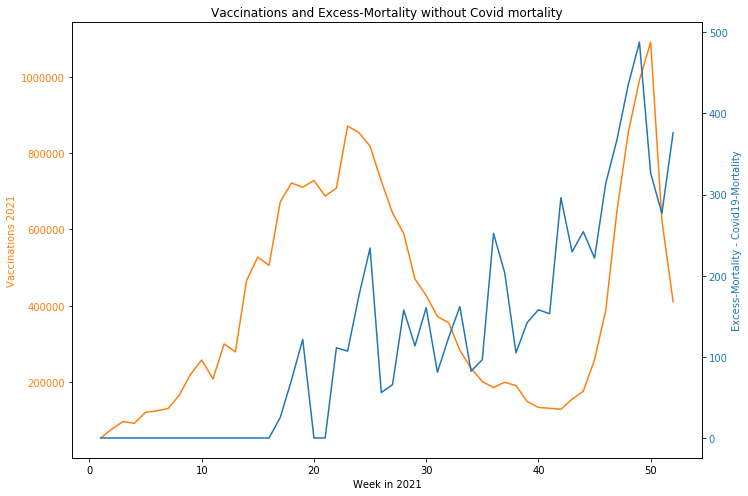
It is noticeable,
- that the increase in visible excess mortality coincides with the onset of the mass vaccination campaign. It appears that there is a time lag, but no reliable statement can be made about this because the onset of the vaccination campaign overlaps with the fading Covid wave, which is out of phase with the mortality reference, resulting in a putative under-mortality before the 16th calendar week.
- That excess mortality continues to rise even after the decline in vaccinations,
- that an imaginary equilibrium line through excess mortality currently implies about 400 deaths per day.
Interpreting the details is difficult, but it cannot be denied that the large and growing excess mortality is related to the Covid-19 vaccinations.
Since no clean cause-of-death statistics broken down by vaccination status exist to date, I must limit myself to at least providing a plausible explanation for the numbers.
Hypothetically, the graph can be interpreted as showing that vaccination deaths occurred initially in the older population and especially in the first vaccination — very soon after vaccination. As vaccination of younger people increases, the time to fatal side effects generally lengthens. This is confirmed when asked in large hospitals. There is apparently an accumulation in intensive care units of completely unexpected deaths of young people with no previous illness (“sudden cardiac death”), in which the vaccination occurred weeks or even months ago. Unfortunately, the DIVI, which is responsible for the statistical evaluation of intensive care units in Germany, has so far not provided a breakdown of patients by vaccination status, let alone which vaccination level was given how long ago. A true publication of these data would put an end to much unnecessary speculation. In any case, an apparently significant excess mortality of about 300 people per day demands an explanation.
Another possible factor as to why the side effects of vaccinations have 2 temporal components is due to the fact that the “instantaneous” side effects are due to the possible direct toxic or allergenic effects of components of the vaccine, whereas the effects that the spike protein, which is first produced in the body, may have are naturally spread over a longer period of time.
In addition, those who received a second vaccination had at least survived the initial vaccination. It can also be assumed that patients with severe but nonfatal adverse events after the initial vaccination did not receive a second vaccination. Both of these factors increase the short-term statistical probability of survival with the second vaccination. The same consideration applies a fortiori to booster vaccination.
Long-term consequences of vaccination, however, have so far hardly been attributed to vaccination, and may therefore accumulate in effect in the absence of precautionary measures.
I would also like to mention the conceivable counter-argument that it appears that the peak of excess mortality precedes the peak of the booster vaccination campaign by 1-2 weeks. In fact, the booster vaccination campaign starts in week 42-43, and the recent sharp increase in excess mortality is in week 45.
Alarmingly, we currently have about 300 excess mortality deaths per day for which there is no explanation other than Covid-19 vaccination until proven otherwise.
Hypothetical explanatory model for the course of excess mortality
The following considerations are purely hypothetical and not (yet) supported by studies. They serve solely to demonstrate that the resulting unexplained excess mortality may be plausibly related to the vaccination campaign using the above arguments.
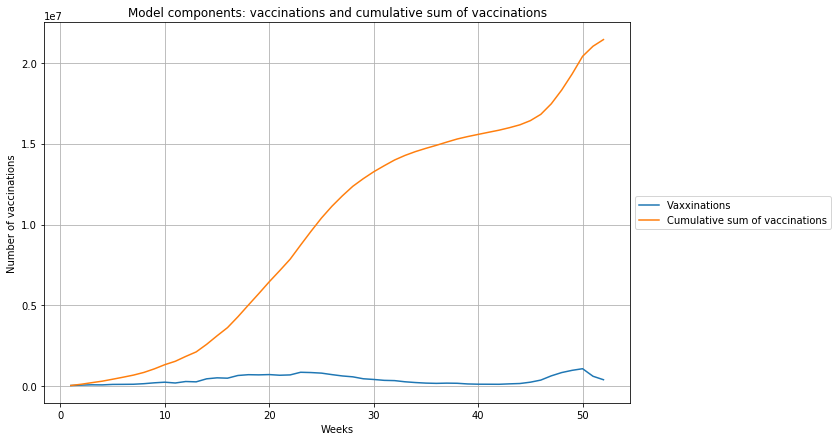
For the increase in excess mortality with a concomitant decrease in vaccination activity, one possible model is that part of the lethal vaccination side effect is immediate within the first few days (“instantaneous”), whereas there is a long-term side effect component that acts for an indefinite period of time and can lead to death even after a longer period of time (i.e., currently several months).
The first component is modeled by the number of average vaccinations in the same week in which the deaths occur. The second component is represented by the cumulative sum of vaccine doses, i.e., for each vaccination, its potential side effect persists into the future, so at any point in time, all past vaccinations are potentially effective. The exact details of the duration of the effect of the different doses is not known, so only an “average” effect can be estimated. These two components are shown in the following graph:
The linear regression estimate of excess mortality from these elementary “effect functions” yields
$ excess mortality = 1.5\cdot 10^{-5} \cdot vaccine doses + 1.3\cdot 10^{-5}\cdot cumulativevaccine doses $
This allows the curve progression of excess mortality to be modeled well:
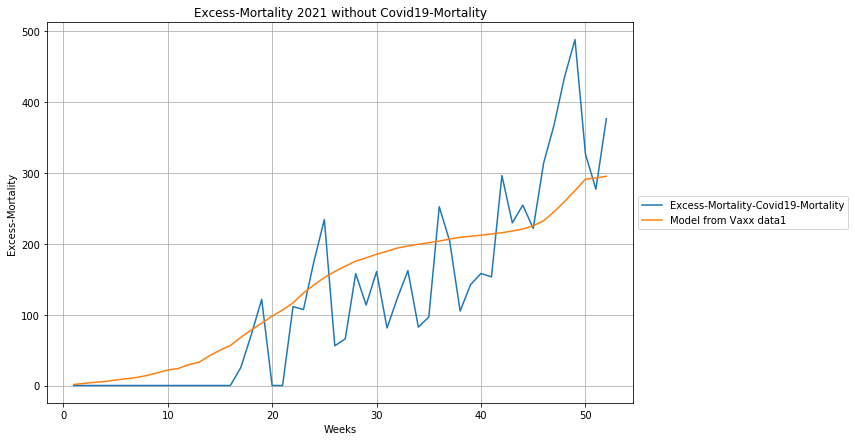
According to the report, excess mortality as a result of Covid-19 vaccination has been close to 200 deaths per day since the 25th calendar week, and has increased by more than 100 in the timing of the renewed vaccination campaign around booster vaccination.
Thus, with robust mortality figures for 2021, there is evidence of excess mortality totaling about 40,000 deaths, far beyond the numbers that can be explained by Covid-19, and for which the only explanation is as a result of mass vaccination.